補遺) numo/gnuplot のインストールとグラフの描画
インストール
gnuplot のインストール
$ sudo apt-get update

  ... (略) ...

$ sudo apt-get install gnuplot-x11 fonts-noto-cjk

  ... (略) ...

$ sudo gem install numo-gnuplot

  Fetching: numo-gnuplot-0.2.4.gem (100%)
  Successfully installed numo-gnuplot-0.2.4
  Parsing documentation for numo-gnuplot-0.2.4
  Installing ri documentation for numo-gnuplot-0.2.4
  Done installing documentation for numo-gnuplot after 2 seconds
  1 gem installed
時系列プロット
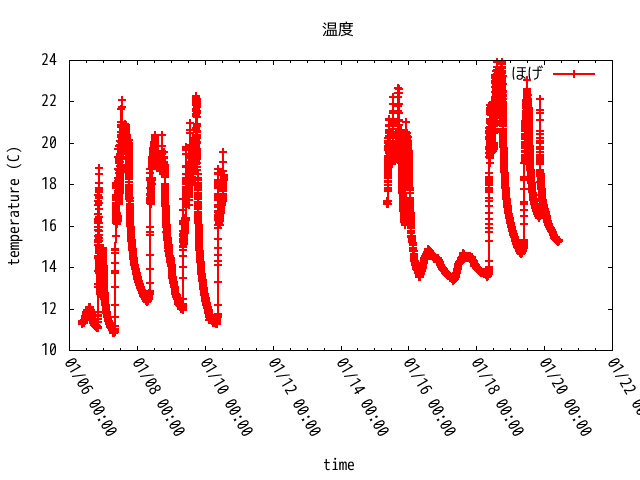
杉山個人の GitHub のレポジトリに, サンプルスクリプトが 2 つ置かれている. それを参考にしてほしい.
- gnuplot.mysqldump.rb : mysqldump で作成した CSV から作図する時に使う
- gnuplot.grafana.rb : grafana で export した CSV から作図する時に使う. CSV に変換する際に "Mode : Series as rows" を選ぶものとする.

スクリプトを実行した時に以下のようなメッセージが表示された場合は, csv ファイルの改行コードを変更する必要がある. Windows と Unix では改行コードの表し方が違う.
$ ruby gnuplot.rb

  /usr/lib/ruby/2.3.0/csv.rb:1883:in `block (2 levels) in shift': Illegal quoting in line 1. (CSV::MalformedCSVError)
nkf コマンドを使うと簡単に変換することができる.
$ nkf -Lu grafana_data_export.csv > temp.csv
散布図
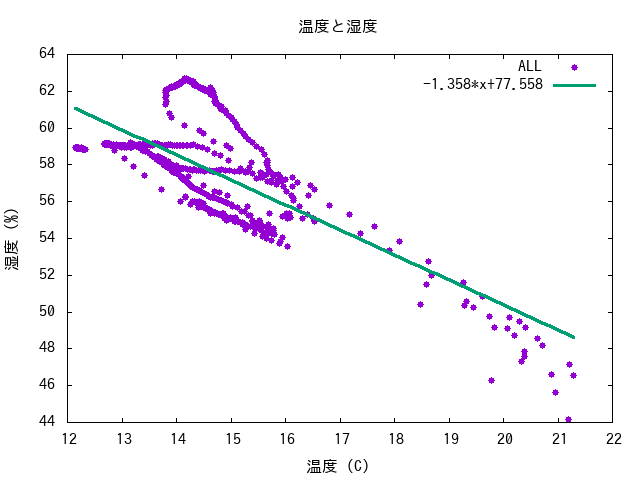
散布図のスクリプトの要点を以下に記す. 2 つの配列を用意して, それを gnuplot の引数として与えれば良い. 以下の例では回帰直線を示す直線も書き込んである. CSV ファイルからデータを読み込む場合には前述の gnuplot.mysqldump.rb や gnuplot.grafana.rb を参照すると良い.
$ vi sample.rb

  require 'numo/gnuplot'

  # 配列の定義.
  var1 = [ ... ]
  var2 = [ ... ]

  # 回帰直線の定数
  a = 77.558
  b = -1.358

  output = "output-test.png"
  Numo.gnuplot do
    debug_on
    set title:    "温度と湿度"
    set xlabel:   "温度 (C)"
    set ylabel:   "湿度 (%)"
    set terminal: "png"
    set output:   "#{output}"
    plot [var1, var2, w: :points, pt:7, title:"ALL"],
         ["#{b}*x+#{a}", lw: 3, t:"#{b}*x+#{a}"]
  end
